NFL Team Betting Trends Analysis: Franchise ATS Rankings and Cover Patterns
 Available in US
Early in my career I made the mistake of treating every NFL team as interchangeable from a betting perspective — a set of statistics plugged into a model. Then I started tracking franchise-level ATS patterns across three and five-season windows, and the data told a different story. Some teams cover consistently. Others bleed against the spread year after year. The reasons are structural, not random, and understanding them has changed the way I build my weekly card.
Consistently Strong ATS Franchises
Over rolling five-season windows, a handful of franchises consistently appear in the top quarter of ATS rankings. The common thread is not talent — several championship-calibre teams actually have mediocre ATS records because the market prices them accurately. The teams that cover consistently tend to share two traits: undervaluation by the public and coaching stability.
Undervaluation means the public perception of the team lags its actual quality. A franchise rebuilding quietly — adding draft capital, developing a young quarterback, improving its offensive line — gets bigger spreads than its underlying metrics warrant because the market still sees last season’s 6-11 record. Americans wagered $30 billion on the 2025 NFL season, and the public segment of that money gravitates toward brand names, not rebuilding projects. The result is that small-market or low-profile teams in upward trajectories become ATS gold mines for a season or two before the market catches up.
Coaching stability matters because a settled scheme produces more consistent performances relative to expectations. Teams with a head coach in their third or fourth year have fully installed their system, their players know their roles, and the week-to-week variance drops. That consistency does not guarantee wins, but it does produce results that cluster closer to the team’s true level — which, for an undervalued team, means covering more often than the line expects.
Franchises That Bleed Against the Spread
The worst ATS teams over multi-season windows are typically those the public overvalues: legacy franchises with large fanbases, teams coming off a deep playoff run, or teams with a star quarterback whose name alone drives favourite money. The global American football betting market reached $9.5 billion in 2026, and within that market the most popular teams absorb the most recreational money — which pushes their lines wider and makes them harder to cover.
I have also observed that teams in organisational dysfunction — frequent coaching changes, front-office turnover, quarterback carousels — produce volatile ATS records that trend negative over time. The line is built on an expectation of reasonable competence, and when a franchise consistently fails to meet even that bar, the market adjusts slowly because each new coach or quarterback resets public hope. That hope-driven delay is what keeps these teams overpriced for longer than the data justifies.
One nuance: bad teams with very low expectations can become strong ATS bets when the market gives up on them entirely. A team expected to win 3 games and projected as a 10-point underdog most weeks has a low bar to clear. If they lose by 8 instead of 14, they cover. The worst teams by win-loss record are not always the worst teams by ATS record, and that distinction is critical for a trend-driven approach.
What Makes ATS Patterns Persist or Collapse
The question I always ask when I see a strong ATS trend for a franchise is: will it hold next season? The answer depends on what is driving the pattern. If the driver is structural — coaching stability, public undervaluation, a young roster improving steadily — the trend tends to persist for two to three seasons before the market adjusts. If the driver is circumstantial — an easy schedule, unsustainable turnover luck, an outlier season from a veteran quarterback — the trend reverts quickly.
I run a simple test: I compare the team’s ATS record to its point-differential record. If the two align — a team that covers the spread frequently also wins by larger margins than expected — the ATS trend has a structural foundation. If the ATS record significantly outperforms the point differential — covering close games through late turnovers or clutch kicks — the trend is fragile and likely to regress.
This point-differential test is the single most useful tool I have for evaluating whether a franchise’s ATS pattern is a signal or noise. It takes five minutes per team and it saves me from chasing patterns that are about to collapse.
UK Favourite Teams and Betting Value
The Kansas City Chiefs are the most popular NFL team in the UK, capturing 9.5% of team-specific search queries. The NFL counts more than 14.3 million UK fans, with roughly 4 million classified as avid, and their team preferences create a secondary layer of market distortion in the UK-facing betting landscape.
When a team has a large UK fanbase, the UK bookmaker receives disproportionate action on that team’s side. This can push the UK-specific line slightly wider than the global market line, creating a small but exploitable gap for contrarian bettors. If you are backing the opponent of a UK-popular team on a UK bookmaker, you may be getting a marginally better price than the global market offers.
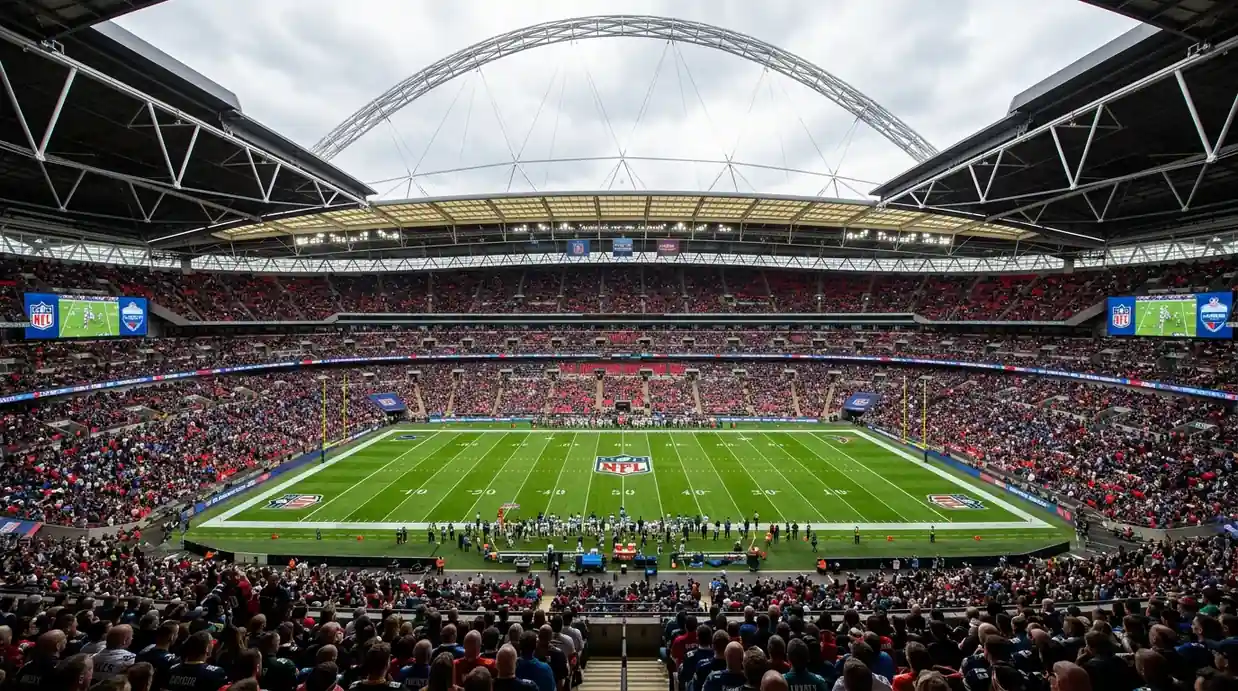
I track this effect anecdotally rather than systematically, but the pattern is consistent enough to mention. In my experience, the effect is most pronounced during London Games and prime-time fixtures where UK betting volume spikes. During a standard Sunday afternoon game, UK bookmakers’ NFL lines track the global market closely and the local-fanbase effect is negligible. The broader ATS trends breakdown provides the framework for evaluating any team’s cover pattern regardless of where the bets are placed.
Do the most popular NFL teams in the UK tend to be overvalued by bookmakers?
Yes, to a degree. Teams with large UK fanbases attract disproportionate recreational money on UK-facing platforms, which can push lines slightly wider than the global market. The effect is most noticeable during London Games and prime-time fixtures where UK betting volume is highest. Backing the opponent of a UK-popular team on a UK bookmaker can provide a marginally better price, though the edge is small and should be combined with other analytical factors.
How many seasons of ATS data should you review when evaluating a team’s betting trend?
Three to five seasons is the standard window. Fewer than three years produces sample sizes too small to distinguish signal from noise. More than five years risks including data from a fundamentally different roster and coaching regime. The key is to check whether the drivers of the ATS pattern — coaching stability, public undervaluation, roster trajectory — are still present. If the team has changed coaches or undergone major roster turnover, older data becomes less relevant regardless of sample size.
Prepared by the nfl Betting Trend editorial staff.